
Companies in a product-oriented business usually struggle to manage inventory at optimum levels. There's a constant tug-of-war going on between the need to have sufficient product to fulfill demand, and the desire to avoid the very costly pitfalls associated with overstocking.
This issue is often tougher for small business owners, trying to manage inventory without sophisticated tools at their disposal. Additionally, without professional purchasing personnel, business owners are susceptible to the dangers of enticing "deals" - purchasing more quantities when prices are favorable, without considering the duration these excess goods will remain unsold on the shelves, or the actual costs incurred by slow-moving or obsolete inventory.
To help with this issue, here are 3 really useful inventory management reports that can help the small business owner in making better decisions about inventory levels, what to purchase, and more particularly what to get rid of.
Inventory “Hits” Report
The word "hits" brings back memories of Top 40 charts, but in this case we're not talking music. The word “hits” refer to the frequency of products on invoices over a given time period. The purpose of this isn’t just to show you how often something sells. Instead, it aims to draw your attention to products that rarely appear on invoices but take up valuable inventory space by comparing hits with holding value and costs.
The data-driven insights gained from analyzing inventory hits can allow businesses to make informed decisions on ordering, discounting, or discontinuing items that are not selling. By doing so, it can release tied-up resources, improve operational efficiency, and enhance cash flow. This valuable data can also be leveraged to implement strategic marketing campaigns that optimize capital and minimize holding costs. Extra Report Tip: Ideally this should be used in conjunction with a ranking report. (This type of report ranks your products in descending order by gross margin generated over the past year (or another appropriate period), and again compares the profitability with the holding cost.)
Inactive Products Report
The inactive products report will show a comprehensive view of products that haven't moved for a period of 6 months or more (or any other appropriate timeframe). This helps to determine the level of inactivity, as it reflects the time products have been on backorder or tied to outstanding purchase orders.
Products with prolonged backorder durations may indicate challenges with supplier fulfillment, production delays, or shifts in demand patterns. The identification of products with outstanding purchase orders is helpful for businesses to evaluate the effectiveness of their procurement process and pinpoint potential bottlenecks.
This report can be utilized to enhance communication and strengthen relationships with suppliers, businesses can avoid stockouts and maintain high customer satisfaction.
Dead Stock Report
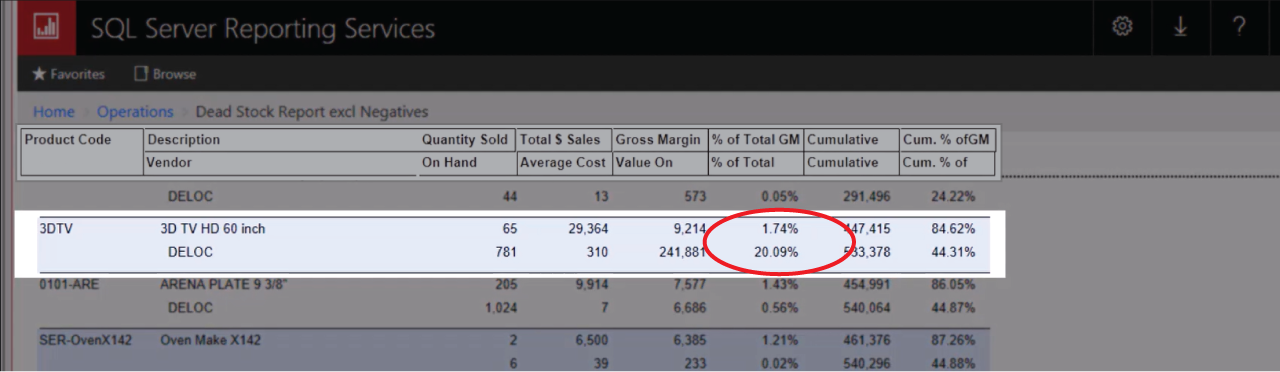
As the name suggests, the dead stock report shows product that are dead or obsolete – they are unlikely to be sold or used in the future. Expired or out-of-season products would be considered dead stock. What’s important is reviewing the cumulative gross margin and inventory value. Business can clearly see what product is included in taking up 90% of the inventory space and not contributing enough to the gross margin.
For example, take a look at the 3D TV below. The report shows us that the TV is taking up 20% of total inventory space but has only contributed 1.74% to the total Gross Margin. Using this as a starting point, we might consider this product to be dead stock.
Hopefully your Inventory accounting software will support this type of reporting, even if via 3rd party reporting tools. To learn more about other reports beneficial to small wholesale and distribution businesses, download our free guide.