Explore the Executive Summary Screen that provides you with a snapshot of the health of your business operations and other reporting dashboards available in Blue Link ERP.
Transcription
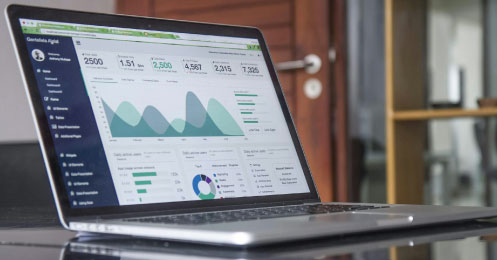
0:07 Blue Link Dashboards provide graphical information to different executives in the company, and there are various dashboards that are canned and provided with the product out of the box as well as the ability to create your own custom dashboards.
0:19 That's useful for executives that want to aggregate information on the start up page and to drill down when appropriate and be able to see the information that's pertinent to them.
0:27 Here is an example of a custom one that isn't one of the supplied dashboards, but that I created myself for a little bit of a sales summary with some drill down through pie charts.
0:40 However, we do recognize that some executives prefer to look at information in a text and numbers based format from time to time.
0:48 To that end, the executive summary screen provides a financial snapshot of key areas of the business, this is a breakdown of your current accounts payable aging and accounts receivable aging, and you do have the ability to double click or drill down into the details behind these numbers.
1:07 In addition, we have a summary of your financial or your cash position by showing you the current account bank balances as well as any unprocessed deposits waiting to be deposited. A quick month to date and year to date snapshot of your income and expenses in your net income or net profit or loss.
1:23 And then we provide a snapshot of current one year ago and two years ago key financial ratios. These are all the traditional financial ratios, including liquidity, asset management, debt management and profitability.
1:35 You're able to validate and understand the numbers behind these ratios by clicking on the supporting figures, which gives you the actual broad data out of the general Ledger on which these ratios are calculated or based.
1:46 And finally on the executive summary screen - Two final thoughts: Number one, we're showing you the current inventory value using whatever evaluation method you've chosen. In this case, it's first in, first out and of course, don't forget that at any stage, if you want to go to the more graphical dashboard options, you can bring them back easily enough.


