Learn how to easily create, edit and share financial reports, such as Profit and Loss Statements and Balance Sheets with Blue Link’s Financial Report Writer tool.

Transcription
0:00 – 0:31 Hello everybody, welcome, to this training session, thank you so much for joining Mark and I, my name is Samantha and I’m the director of marketing at Blue Link. So, I think there might be a couple people still slowly joining, but we’ll let them in as they get here. What we’re going to do is we have all of you guys on mute, but if you do have any questions, feel free to just ask them in the chat and I will kind of be manning that and then at the end after about 30 minutes or so, we will be able to go through some of those questions.
0:32 – 1:04 If anybody you know can’t hear me or is having issues with the audio, please just also let us know in the chat. Hopefully everybody is doing well through some of this crazy coronavirus stuff. I know things have been pretty hectic and weird lately, so hopefully this training session will give you guys something to focus on and allow you to maybe get some better use out of some of the Blue Link tools that we have to offer. And it sounds like things are maybe going to start looking like the new normal soon, so we’ll have to just kind of keep in touch as we see what’s happening down the road.
1:05 – 1:25 But I guess without further ado, thanks again for joining us. There is a reminder that there will be another training session tomorrow as well as one next week. If you have any questions or trouble accessing those, just reply to the emails that we sent out initially and we’ll make sure that you guys are all included in the appropriate people from your team is included as well.
1:26 – 1:32 So with that being said, I’m going to introduce Mark Canes, who most of you know as the President of Blue Link and he will be the one leading us through this session.
1:33 – 1:59 OK. Thanks, Sam. So, Hi, everyone. Sam, just I want to verify a couple things. Number one, can you hear me clearly? I can, yes. OK, #2, if I change the slide that I’m displaying to the agenda, do you see that? I do, yes. OK, now I’ve changed back. OK, perfect, perfect. So as Sam said we’re keeping everyone’s microphones off just so we can stay on point and get you back to whatever else you need to be doing as quickly as possible.
2:00 – 2:19 Let’s try and get through what I want to convey or to you guys within the next half hour, but then we will have some time at the end for questions and answers which you can type into the chat window. Samantha will be monitoring the chat window and at the appropriate time or towards the end, she’ll start throwing some of the questions at me and hopefully I can answer some of them.
2:20 – 2:42 So without further ado, I’m going to run through a few slides first and then we’re going to get our hands kind of well I’m going to get my hands kind of dirty on some financial reporting. So, first of all to make sure that everybody understands what we are looking at today we are looking at Blue Links, relatively new financial report writer which is an add-in to Microsoft Excel. It is for creating financial statements.
2:43 – 3:07 So I’ll actually jump to the next slide. I’ve labeled this slide agenda. We’re not really going to follow this agenda strictly. It’s more like a cheat sheet for what I need to make sure I’ve covered with all of you towards the end of this session, but starting off with number one, what is what is this? This is a Microsoft Excel add in and it reports on general Ledger data only.
3:08 – 3:36 So it is designed to create financial statements, profit and loss statements, balance sheets, statements of cash flow, etc how? And the Third Point there #3 is. However, however, this is Excel. Somebody with the appropriate Excel skills is able to build financial statements and reports that relate to non-general Ledger data such as sales history, purchase history, inventory records in the same Excel workbook and link them together.
3:37 – 4:03 We’re going to see an example of how you can do that. Now the majority of you on this call do not actually have the financial report writer, so very briefly. This is a tool that is provided basically free of charge to our hosted customers and they’re relatively small nominal monthly fee to our on-premise customers because there is a cost of installing something on your own server that doesn’t exist when you’re in a hosted environment.
4:04 – 4:30 So it is available and can be requested by just communicating with Joanne Fazari, our customer service manager, or even just sending in an e-mail. We can arrange to get this kind of installed and set up for your use. So, the purpose of today’s session is to introduce you to some basic usage as well as give you a sense of what this tool is and therefore whether or not you might want to use it.
4:31 – 5:11 Now at this stage it does not replace the built-in financial report generator that is rather archaic in that that will still exist, but there will be no further development or enhancements on that it is kind of old technology, it kind of works, but it’s limited in what you can do. So you’re going to see how the new generation of moving financial report writer can actually work for you. A little bit of history, a year ago this time it was still being developed. It went into initial beta testing and three customer sites plus Blue Link’s own use in the summer of last year and was made generally available in the late fall. And we initially rolled it out very slowly and very carefully and cautiously.
5:12 – 5:28 There are some known issues, but they all relate to performance and speed as opposed to actual functionality. And we do already have a laundry list of requested new features which are on the sheet for discussion when we do our next iteration of the product, which will be during this coming summer.
5:29 – 6:02 So without further ado, what I’m going to do now is I’m going to go ahead and jump to a slide where I also want to make you aware of. If you do start working with the financial report writer, add-in. There are some resources. There is a user guide that you will get as part of your installation. It’s a 20 something page user guide it is fairly comprehensive. It is written in plain English, it has screenshots, it’s very easy to read and follow, and there are also some training videos. And on the side of the screen over here is basically a YouTube video training video.
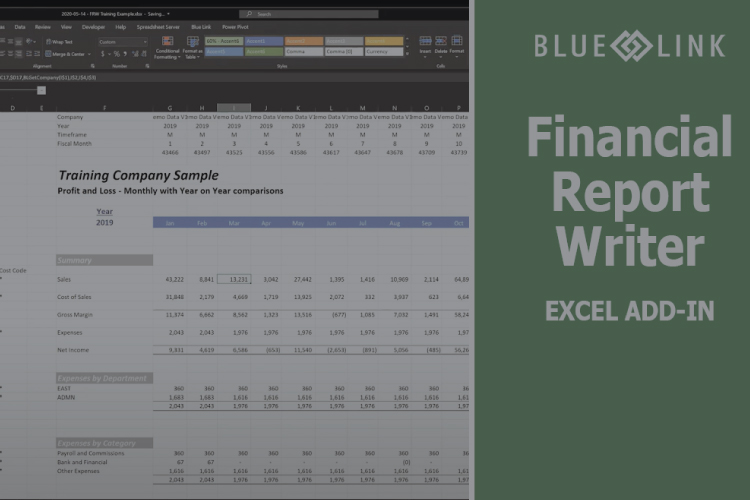
6:03 – 6:23 It also gives you an idea of what a financial statement might look like. This is an example of a financial statement that gives three-year rolling months plus year-to-date and last years date, the charts and all that kind of stuff. So, this is an example of a finished financial statement. The training resources so far have proven to be more than adequate for almost all the other users that have started using the software.
6:24 – 6:42 So while we have provided some one-on-one training, it’s kind of being superfluous. The user guide and the videos between them seem to have been sufficient for people to get started, so really what I’m going to cover today is going to be a subset of what the user guide and what the videos cover. But again, hopefully it’ll give you a reasonably good starting point.
6:43 – 7:06 So, let’s jump ahead to excel. OK. So, Sam, just want to confirm, you can see training company sample on your screen now? Yes. Yeah. OK, fantastic. So we’re in an Excel workbook and we are looking at a financial statement now. This is pointing to the demo data that we typically use for sales demos.
7:07 – 7:26 So there’s not a lot of transactions in it, but there are enough and there are several years worth of transactions. So what we’re looking at here is a very simple profit and loss statement for the year 2018 showing month by month numbers and then it’s showing your year to date or your full year’s amount, it’s showing the previous year and two years ago.
7:27 – 7:51 This is just an arbitrary statement that I created for this training session. Uh, just wanted you guys to know that I timed myself with my stopwatch on my phone and it took me just under 11 minutes to create the statement from beginning to end. And to be honest, about half that time was trying to figure out the appropriate color schemes and shading and fonts for these headings and stuff because my visual design skills are absolutely abysmal, as you can probably tell.
7:52 – 8:22 But what I did do here is I wanted to create a statement that we can look at, and then we can sort of unpack it a little bit to see how I managed to create this. And then we’re going to ultimately at the end of the session, towards the end of the session, in about 20 minutes from now, we’re going to actually create a statement from scratch from like a blank screen. But the starting point is that this is a financial statement that, for example, summarizes a bunch of accounts into one label called sales, summarizes another bunch of accounts into cost of sales, then uses simple Excel math to calculate gross margins, etc etc.
8:23 – 8:50 I then decided to further break down my expenses. So, this expense amount over here. This line here is further broken down by just aggregating them by department. My demo data has two departments, every account, every expense account belongs to one another, the departments. So, I broke it down this way. And then finally I also broke it down by groups of accounts. And again, you’ll see how I group these accounts to three different groupings and again, obviously the numbers should all match.
8:51 – 9:22 Now one of the advantages, well, two of the advantages of using Excel as a financial reporting tool and many of the generally available financial reporting tools for many other ERP systems are also excel add-in’s and for the same reasons. Number one, if you have Excel skills, which most of us accounting people do, you’re able to use those Excel skills, you can use your conditional formatting, you can put in a formula, you can do whatever you can do in Excel and make the statement look how you want and do calculations on ratios and all that kind of stuff.
9:23 – 9:38 But the second thing is that because it’s Excel as opposed to more traditional reporting format, it’s interactive. So, I’m going to go and change the year from 2018 to, I don’t know, let’s say 2016, and watch how the numbers update as soon as I hit enter.
9:39 – 10:15 So in real time I’m now looking at different periods. Same thing if I go and change this to 2017, or 2019, you get the idea. So, one of the most advantageous uses of this is you’re not only using this text, you can print it. Yes, you can still print a report, you can generate a PDF, you can print it on paper, you can create all kinds of balance sheets and income statements and so on that you can distribute and publish. But the idea is that you can also work with it interactively. So the next thing that’s really important to understand is that when I say interactive, I really do mean interactive.
10:16 – 10:49 Let’s just say that I’m a little bit suspicious about this sales number of 64,892. Seems a bit of an outlier. I can drill into the detail and see which GL accounts make up that balance and just as you’re loading the transaction detail behind those accounts. So right off the bat, I can see that these are the three accounts that actually make up that amount and it’s just busy loading the actual detailed transactions behind these accounts once it’s finished loading and it just takes a little while. This is one of the performance things I mentioned earlier. Takes a little while. First time you do it and the rest of the session you’re fine.
10:50 – 11:15 But I can now look at this account which has 64,854, click on it and see the transactions that make it up so I can see what’s going on. Looks like it was one very, very big sales order. Looks like it’s invoice #50970 that was for $65,000. So a fairly useful thing. So let’s look a little bit of the magic that’s behind it. How did we actually get to this?
11:16 – 11:52 So first of all, what is actually in the cell? How did this the $64,892 get there? Well, if you look in the, if you look up here in the title bar, I’ll just highlight it. Well, that didn’t probably show up all that well, but there is a formula that’s called BLFS formula. This is a custom formula that we have added to Excel. It’s part of the Excel add-in that pulls information from your general Ledger numbers, actually from the General Ledger transactions, aggregating them by fiscal month and by fiscal year.
11:53 – 12:28 And by the way the system does this right report right, it does respect non-calendar fiscal years as well. My demo data is set up as a calendar year, but the BLFS formula recognizes different fiscal years, and what it’s doing is it’s referring to different parts of the spreadsheet to figure out which GL transactions it should aggregate and present in the cell you – now here’s the good news you do not ever have to understand this formula. You can if you want, but you never, you never have to, because we have a tool that allows us to automatically create the formula pointing to the right things.
12:29 – 13:00 What this formula points to is a number of cells that are currently hidden. Those cells are hidden because I use the little feature of Excel called grouping. This is just an Excel feature so some of you more power users in Excel will know about grouping. If you don’t doesn’t really matter. I just kind of like using it to hide the columns and the rows that we don’t really need to look at when looking at a financial statement to make it look kind of prettier or more professional maybe as is the better word, but and I can collapse them and expand them by just with a single click.
13:01 – 13:25 So I typically tend to hide the left most 5 columns, or the left most 4 columns actually, and the top 6 or 7 rows actually. I guess it’s 5, so if we don’t need to actually look at them. But essentially what our BLFS formula is pointing to, is it’s pointing to some of these things at the top of the column to figure out which fiscal year it should be pulling, whether it’s pulling a month or year to date number.
13:26 – 13:53 So you can see month here, year to date over there and which period we’re interested in. So period 10, period 9. Period 8, period 7, etcetera. And then it’s looking on the left-hand side in this particular scenario for the account number or the group of account numbers, the department or group of departments. And then also for those of you who do use job costing, we can also drill that. We can also go down to analyzing our financial statements by the job code and cost code.
13:54 – 14:17 For anybody who signed up to tomorrow’s training session with Darren on how to use job codes and cost codes to actually further slice and dice your transactions, that session will tie back to this. So, I’m not going to talk too much about these other than to understand that you effectively have up to four different segments, if you like, of your GL, which you can use to slice and dice for financial reporting using this tool.
14:18 – 14:52 Now, you probably already realized that you used an asterisk as a wild card. So, an asterisk means everything. So, 4 plus an asterisk means any account that begins with 4, and then we’re including all departments, all job codes, and all cost codes. Similarly, I’ll be here with expenses 6with an asterisk refers to all accounts that begin with a 6, which I happen to know all my expense accounts and then you will notice over if I just expand column A little bit, you’ll also hopefully notice that down here I’ve got these groupings of different expenses by category by just creating ranges of accounts.
14:53 – 15:34 So account that to that, account that to that, account that to that. I can also put in discrete individual accounts by separating them with commas, and there’s actually a way, believe it or not, of saying I won’t include all accounts between 60000 and 60100, But then I could say except. This account in that account. So, there are exceptions. These are all very easy to easy to follow and well documented in the user guide. But the concept here is that we’re able to tell the financial report writer to grab my General Ledger data, follow this left-hand side to decide which accounts to include on any given row, and follow the information at the top to figure out which periods, for which periods to include the data in a column.
15:35 – 6:09 An important point for the more advanced financial report writers amongst you is that you have the ability to change where things are. So, for example let’s take department. Great example. If you wanted to have a departmental profit and loss that laid out the, let’s say the revenue and expenses department by department in the columns. Yes, you can move the department reference from being on the left-hand side to being at the top and then have your departments across the columns and again this is explained in one of the training videos as well as in the user guide.
16:10 – 16:55 So just before we get to looking at how to build a report from scratch, which is what we’re going to get to in a couple of minutes, there’s one very obvious elephant in the room that I kind of have and I just, I used but I didn’t say anything about it. Part of the magic of any add-in in Excel is the ability in all versions of Excel since like I think 2007 or 2010 to be able to create additions to the ribbon. So, the same Excel ribbon that you’re accustomed to using for whoops. Not for home, but for things like, you know, insert, draw, home, all these different things we were able to add in a Blue Link ribbon and that blue link ribbon has the icons that you need to actually use the system.
16:56 – 17:28 What happens is, you can, first of all you can point to financial board right at multiple different companies. OK, you will need our technical teams assistance to actually set that up. It uses something called web services and you have to get something called a WebQ an API key. But when you set up company connections you actually set up the pointer to the actual company data and you set the credentials of the user that is entitled to use this to somebody who has access to the general Ledger.
17:29 – 17:59 So somebody who should not have access through the Blue Link user interface to General Ledger will not be able to use this. So, if this is your own personal excel, you would put what’s called a cached username. So, you would actually save your username with these credentials. But if this is Excel on a server that multiple people could use, you would not save a username. And then you’d have to log in using your Blue Link Elite, login every single time that you fired up this report writer to make sure that you are a person that has access to the general Ledger information.
18:00 – 19:01 So it’s just a security thing. The other three icons on here are fairly self-explanatory. Refresh data allows you to pull the latest data from your General Ledger. So, the way this actually works is behind the scenes it is storing the relevant General Ledger information in a hidden tab of the spreadsheet that you can never unhide, so it’s completely locked down. There is no way, but it’s actually loading that data into an invisible tab with the spreadsheet, which is one of the reasons that we’re able to see things happen so quickly when we do things like changing the year for example, because it doesn’t have to go out and reach out to the database. It’s simply pulling it from a hidden tab on the spreadsheet. Therefore, when you want to get the most up to data you need to click on refresh data, pick the company you want to click on that company and this is an area where it’s a little slower than I’d like it to be. The first time you do this after booting up Excel, it can take up to 20-25 seconds to load the data. I haven’t seen it take longer than that no matter how big the data is.
19:02 – 19:27 If you then go and work around a little bit and then want to refresh it again because some of your colleagues may have processed transactions, it’s there usually pretty quick. It’s four or five seconds to refresh the data. The drill in-to selection we’ve already seen. We’ve already used that ability to click to highlight any cell that has a formula, click on the drill into selection button and pop up your drill down to details screen. Where we’re going to go next is we’re going to use this insert report button.
19:28 – 20:07 So what we’re going to do in the next. Um. maybe four to five minutes is we’re going to create a multicolumn profit and loss statement, the summary one just to see how quickly and easy it is to do and just to verify that we don’t really need to understand the BLFS formula. So, this is how you would how I always start off a financial statement, I’m going to go to a brand-new tab, let’s just move it to the end of the pedantic about that and what I’m going to do is I’m going to zoom a little bit to make it a little bit bigger so we can see what we’re doing. So, what I do is I click on insert report, screen pops up asking me to choose the company, I’ll choose our demo data.
20:08 – 20:49 Do I want to specify a specific group of General Ledger accounts, or do I just want them to be all? I’ll leave the asterisk in to get all of them. Same thing with department, job, and cost code. Which fiscal year I’m going to use 2019 because there’s very little data in 2020 in my demo data. Starting month for the statement, I’ll leave it as one balance type very important. There are three balance types. (M) month means the movement the net transactions for all appropriate accounts for the month should go into the column that we create. So I should explain what we initially going to create is a single column single row report that we will then use as a basis to create a multi-column multi-row report.
20:50 – 21:06 Um, so in the column, do we want to show the net transactions per month? Do we want to show a year-to-date transaction amount, or do we want to show a year to date balance which would include year to date transactions plus any opening balance?
21:07 – 21:27 So if you were going to use, if you were creating a balance sheet, you would use this third one B because that adds your opening balance of your asset, liability and equity accounts to the transaction value. Honestly, for income and expense accounts, it really doesn’t make a difference whether you put B or Y because your income and expense accounts will never have an opening balance.
21:28 – 22:02 So you’ll get the same number for both of them, but for balance sheets obviously will make a very, very big difference. And so, for balance sheet accounts, if you’re creating a statement of cash flow for the appropriate lines on your statement with appropriate columns, I should say you would actually be using your year to date because you don’t want the opening balance for the change in receivables and things like that anyway, I’m going to leave the default of math and I’m simply going to click create every time you create a statement it asks if you want to get updated data. I’m just going to say no to save a few seconds, but it will ask if you want to go and pull refresh data from the database and put it into that hidden tab of the spreadsheet.
22:03 – 22:22 So all we have now is we have a single line statement it has one cell that actually has a BLFS formula, it has all accounts, so therefore it should be zero if our trial balance balances, which it does and it’s for the first month, in this case January of 2019.
22:23 – 22:46 Now for those of you who are a little bit more familiar or comfortable with Excel. You will recognize that the parameters that the BLFS formula is pointing to the cells that it’s pointing to most of them have a combination of relative and absolute cell addresses, so if you don’t know what relative and absolute cell addresses or you may want to brush up on that before you use this tool.
22:47 – 23:17 But essentially what this allows us to do is it allows us to copy a formula and not lose the reference to the appropriate column or the appropriate row. The dollar sign is the clue as to whether we’re freezing the row or freezing the column. Get lots and lots of free online resources on how to use absolute, relative, or partially relative cell addresses in a formula in Excel. This is an Excel thing. It’s not a Blue Link thing, it’s a standard Excel thing. But because of this I’m able to actually copy this formula and still have it pointing to the right places.
23:18 – 24:04 So the first thing I’m going to do is I’m simply going to take that row. So, I’m going to copy it and I’m going to paste it maybe a couple lines down. And I might just do that again a few more lines down. Um. Let’s make that column wider and let’s call this income or revenue. Yeah, I’ll just call it income. Um, well, let’s call it sales actually. Let’s called this costs of goods. So, I’m not really doing anything particularly exciting now. This is just boring housekeeping and let’s call these expenses. But now what we can do is we can start getting a little bit clever because we can say I know that all my sales accounts begin with a four, so let’s just put it that in as four.
24:05 – 24:36 Immediately changes the number to minus -4322. Don’t worry about that. I’ll come back to that in a moment. I know that my cost of goods sold, account or accounts all start with 5, so I’ll just change that to a 5. And I know my expense accounts all start with 6, so I’ll change that to 6. And just like that I’ve created 3 rows, one for sales, one for costs of goods, one for expenses that are linked to data, so that if I change the month from one to let’s say 6, the numbers change immediately to reflect the appropriate month 7, et cetera.
24:38 – 25:33 I don’t like the fact that this is shown as a negative number. So, all I need to do is simply use a basic Excel skill, edit the formula and put a minus sign right at the beginning. So we typically tend to do this for revenue and on balance sheets we typically tend to do this for liabilities and owners equity accounts So now what we have is we have sales cost of goods sold because we know Excel we can easily say that our gross profit, gross margin, which if you want to call it, you’ll notice I spend more time fixing typos than actually doing the work. Is simply an Excel formula saying that minus that simple as that, and then we can of course do the same thing down here. We can say net income. Well. Even for me these typos are really bad today and it’s the same thing. It’s equals gross profit minus expenses.
25:34 – 26:10 So now I have a single period summarized profit and loss statement and that really took just a few minutes. I’d like to make that, uh, spread that out over a few months or maybe an entire year. So the first thing I’ll do is I’ll grab that entire column. Copy it and paste it. Now, there is a reason that I am going to do what I’m doing in the sequence that I do it, and it is a little bit of a, it’s what Microsoft calls a feature in Excel and what I call a bug. But I’ll change this to number two period #2. So now we’ve got January and February, and then what I can do is I can highlight both columns, grab the little copy handle here and copy it across.
26:11 – 26:28 And it’ll keep incrementing the month appropriately and we will get a 12 months of our P&L. And again, same thing, if we look at that 64,000 and we drill into selection, we will get the same drill down information as you saw in the previous statement because it’s basically pulling the same data.
26:29 – 27:12 So as quickly as that I’ve created a simple statement that gives me 12 months worth of worth of data. I can also add if I want very quickly another column, copy paste, change that from month to year to date and I’ve got my year-to-date numbers. So, relatively short order, we have created a new report. We have done pretty much most of the heavy lifting to get to a statement like this one over here. Other than the formatting, but there is one thing that we haven’t done here. I don’t have an easy way of changing the year of quickly flipping to different years because right now the year is hard coded in each one of these.
27:13 – 27:27 Now what I typically do, and this is just an Excel hint, but it’s a very strongly recommended one, is find a place somewhere on your statement where you’re going to want to put the year and allow people to or yourself to flip around and change the starting year.
27:28 – 28:21 I’ll typically maybe insert a column, and maybe what I’ll do is insert a couple of rows as well. Uh. Just to create myself a little bit more real estate doesn’t really matter. You don’t have to go to the length that I’m going to, but I’ll put in label saying here and maybe what I’ll do is just make these both centered using my regular Excel tools. And I’ll plug in a starting year here. And for now I’m going to put 2019. And now what I do is I say, let’s make that equal. That year. Let’s go to the second month and make it equal the previous one, and then I can simply copy that all the way across. Copy all across and paste. So therefore, the year is actually in each column is actually a formula and ultimately it comes back to this.
28:22 – 28:51 So when I change this to 2018, everything changed to 2018 and we’re good. Beyond that, there are basic Excel skills. Again, not Blue Link financial report writing skills, but basic Excel skills that I use to generate things like the actual month name labels and things like that, the grouping and so on. But honestly the most of the intelligence that went into this report, the report on the profit and loss tab is already here and we’ve, most of our work is already done in terms of creating a nice profit and loss statement.
28:52 – 29:24 So going back to what I said at the beginning, towards the beginning of the session, the, actually I’m going to just address one of the questions that that came up here. Umm. One of the questions was ‘Would you be able to combine two companies’ financials together?’ and the answer to this is yes, there’s a, However, the however is be aware that if they have different fiscal years then be very careful of getting results that you don’t expect.
29:25 – 29:59 The easiest way to do that is one of the things that the BLFS formula refers to Is. I’ll just expand this column quickly. Is the cell over here which determines the company. Now the company name will match one of these, or you’ll get error messages. So you’ll see demo data V14, which is that’s the pseudonym that I gave the company. You can call it whatever you like. By the way, you’re not locked to whatever the name is in in the Blue Link Elite system master, for example. But whatever name you’ve given us here, whatever alias you’ve given it here has to appear here.
29:60 – 30:42 So if I were to simply change in any one of these columns, if I were to change this company name from Demo Data V14 to Blue Link Associates or whatever that other company was a something or other, it would immediately pull those numbers instead. So given that it’s Excel and given that you can then take column G’s company one, column H is company two, and then column I could be G + H Now you’ve consolidated those companies. I would also just be very cautious when you are consolidating to be aware of that, obviously eliminating intercompany entries and things like that, but that’s a whole other accounting discussion, but yeah, so you can definitely combine two companies’ financials together.
30:43 – 31:14 There was another question at the same time from the same person. Um, ‘Would it work with 13 periods as opposed to months? And if you do have the Blue Link variation on 13 period GL, Then yes, it will actually work with 13 periods. OK. Umm. So, I think, Sam, I think if I’m not mistaken, those are the questions we have today before I get on to using some of the last few minutes to show something that I think is really cool. Yeah, those were the questions so far.
31:15 – 31:45 OK, very good. OK. So, I wanted to show, I wanted to showcase two things. Firstly, I just wanted to showcase you remember we discussed earlier on the difference between the year to date and the Y and the B and I just wanted to demonstrate that. So, on this tab I’ve created a single line which has all my asset accounts. So, my asset accounts balance as of. Um, I guess the end of 2019 fiscal month 12, so the end of 2019, the total balance of all my assets is $940,865.
31:46 – 32:18 However, if I change the B to a Y. You’ll notice that it changes to $143,435 and that is the net transaction value. So obviously my opening balance was in the 700 or something $1000 for all my asset accounts before we even started the year. OK. So, I just wanted to point that out and show you that that does work. So, if we go back to B, it’ll do that. However, again, I’ll just go back to my profit and loss. And again, I’ll just point out that if I do that with my income and expense accounts, it makes no difference because there are no opening balances.
32:19 – 33:02 So, the last thing if I go back to my the thing that I said right at the beginning I said this is an Excel add-in. It reports on General Ledger data only. And then I said however and here’s my however. As many of you hopefully know, you can link live link an Excel spreadsheet to any data source that you can get access to, including a SQL Server database. Blue Links data is stored in a SQL Server database and many of our customers therefore use Excel to link to sales history, purchase history sales is usually the most widely used one, and generate things called pivot tables in Excel.
33:03 – 33:42 If you’re familiar with pivot tables, you probably know already where we’re going. Um. So, let’s um. Go there quickly now. I’ve created a pivot table here that is linked to the same database, the exact same data demo data as we were looking at and what it’s doing is it’s doing a sales by. I guess this is by category. Let’s just see. yeah, sales by category by month for a given year so on this in the same workbook albeit on different tabs I have a profit and loss for 2019 and I have my sales by category.
33:43 – 34:19 Now, you absolutely could underneath this pivot table insert a financial statement or underneath the financial statement insert a pivot table. You could also do them side by side. The danger there though is when a pivot table refreshes, or you change the selections. It could basically rearrange your screen a little bit for you. So, if you are going to insert a pivot table next to a financial statement, I would do it to the right, not to the left. And I would do it below the financial statement, not above the financial statement to avoid unpleasant surprises when you suddenly change something in a pivot table for those of you have in case anyone not familiar with a pivot table.
34:20 – 35:16 Pivot table’s a great way of analyzing in real time. This is all linked to the Blue Link data. I did not key anything in. I only used the mouse to do this, and I can change things around if I don’t want to do analysis by category, but I want to do analysis by oops. Why is that not grabbing? OK, there we go. I got rid of category and now I’m going to bring in customer. Now I’m doing an analysis of sales by customer for, per month etcetera. So very, very, very, very cool tool. I can change the columns; I can get rid of months or whatever the case is. But here’s the thing, if I change the, if I go to the profit and loss now and I change this year to 2017. Financials are now for 2017, but my pivot table is still 2019. Not as cool. So, here’s tip number. Here’s sort of my final tip for you if you are going to do this kind of thing.
35:7 – 35:50 If you’re going to have non-financial data in a workbook that you want to sync with your financial statement data, then what you do is you go back to this cell probably if you want to be very careful after what after you do what I’m about to do now. You then maybe want to lock the cell and protect it, so you don’t accidentally change it, but instead of it being a number you point it to your pivot table selection and now, any time and then you use your pivot table as you’re deciding factors.
35:51 – 36:32 If I want to change to 2017, I change my pivot table to 2017. Here’s my sales by customer for 2017 and here’s my profit and loss for 2017. Pretty cool. So, one just in case anybody else there is paying real attention. My sales for the year for 2017 per my general Ledger are $189,000, but my sales by category for customers is $190,000. And the reason is just to test the theory, there is a single journal entry in that year that actually debits the one of the sales accounts and credits are work in progress account. OK.
36:33 – 37:01 And this is one of the most common reason why your sales reports will not agree with your sales accounts in the GL is that you have entries in the GL that do not go through sales history because they are General Ledger, General Journal entry adjustments, they are you know to sales, they are accounts receivable vouchers. Things that don’t go through sales order screen or an RMA screen will not show up obviously in this detailed sales analysis even if they go to those GL accounts.
37:02 – 37:14 So that’s pretty much and I see I’ve gone a little bit over advertised time, but that’s pretty much all that I was going to show. And now we will turn it over to questions and answers. Sam, do we have any other questions that I haven’t addressed yet?
37:15 – 37:27 Yeah, there’s just one more question that has come in, but if people have other ones, now is the time. So, the next question is. ‘What is the quickest way to verify that the P&L numbers are accurate in the spreadsheet to Blue Link numbers?’
37:28 – 37:52 That’s a good question. I mean, me personally, I kind of know they are as long as I’m choosing the appropriate accounts, but you have a good point. I would say that one of the best things to do if you could have true P&L and you’re grouping all your accounts together. The one thing that you know for sure is that if we go back to our, well actually let me just do it this way. Actually let me go back to this statement over here.
37:53 – 38:46 So if we go back to our initial in fact, I’ll copy this into our initial, the line that we initially that initially gets created has all of your numbers, so it has like you know, all the numbers should be zero, which proves that your trial balance balances, also, those numbers are taking in real time from your General Ledger. So, if you wanted to verify that this net income is correct and that you haven’t excluded any expense accounts or sales accounts or things like that one, probably one of the easiest ways to do that. And again, this depends on how well how good your GL account number structure is, would be to do things like saying, well what I want to do is I want to take, I want to aggregate this as being just from account number, let’s say 40000 to account number 9999999 I’m guessing.
38:47 – 39:19 I don’t know if this makes sense but yeah it looks like they do. We’ll create a formula somewhere in your statement at the bottom that incorporates all the entire range of profit and loss accounts. You don’t have to separate them. You can have sale you know income and cost accounts and expense accounts all in the same range, but as long as that range does not include any asset liability or owner equity accounts then that will in one line be sure to give you your net income which you can then order against these and what you could do to make your statement not look ugly potentially is you could kind of move this further down.
39:20 – 39:43 You could take this line and move it way, way down to where you don’t see it. And then what you can even do if you want to use very nifty Excel skills is you could say create a line just underneath your net income which is going to be your statements net income less the one that you know is correct and then use conditional formatting to not show this if the value is 0. So, you’ll only see numbers showing OK if it’s zero.
39:44 – 40:17 Again, conditional formatting being an Excel skill so I’m not going to go into it, but conditional formatting pretty self-explanatory off of the home tab of the ribbon in excel. So that would be one way. The only other way I can think of, and honestly this is what I’ve done as well, is in Blue Link Elite itself. One of my favorite screens is the GL inquiry screen, and I just go to the GL inquiry screen, filter for only income and expense accounts, click display, and then the bottom line, the total at the bottom of that screen is my net income for the current year, previous year in two years ago and that’s an easy way to now ordered the year-to-date number.
40:18 – 40:47 So hopefully that answers the question. Awesome. So that was the, uh, the last question. There was a question right at the beginning about whether we would be sending out a recording. And the plan is, yes, we were having some technical difficulties earlier. So assuming those have been resolved, I will be able to send out a recording of this to all of you as well as to you guys can forward it to anybody on your team.
40:48 – 41:11 OK, great. Well, I don’t want to keep anybody longer than is necessary, although I think we were sort of we did budget about 45 minutes, right Sam to allow for Q&A. So I think we’re good for time. Yeah. But yeah, I’d like to thank everybody for attending. Hopefully I didn’t go too fast. Again, I will emphasize that the user guide which will always be updated.
41:12 – 41:36 We will release a new release with any new features is comprehensive. It does tell you everything that you need to know the training videos that exist. Plus, this video of this session will be available, and we will be adding a little bit more in terms of training videos when we do the next release. We’re going to work on the summer because we are going to be adding two or three additional features and at least one additional button on this Blue Link ribbon at the top.
41:37 – 42:05 And I just added my e-mail into the group chat in case anybody does have questions about this or wants to learn more about setting it up for your company. If it’s not something you have, definitely just e-mail me and I’ll try to answer any of your questions. Perfect. Well, thank you very much. OK. Thanks all and hope everybody’s staying safe and let’s get through this together.
Discover how the Financial Report Writer Excel Add-In simplifies complex financial reporting for distributors. This powerful tool integrates seamlessly with Blue Link ERP, allowing you to generate real-time, customizable financial reports directly in Excel. For distributors, this means better visibility into profit margins, inventory costs, and revenue streams, enabling faster, data-driven decisions. Watch our video to see how you can save time, improve accuracy, and gain valuable insights into your distribution business’s financial health.
Blue Link ERP provides integrated Accounting Software and Inventory Management Software to small and medium sized businesses, primarily wholesalers & distributors. READ MORE
 Skip to content