It is pretty normal for many small businesses that don't have a purpose-built system to manage different aspects of their operations such as inventory and sales completely separately. It’s easy enough to manually track inventory when you only have so much on hand. These small businesses typically use QuickBooks as introductory accounting software and Excel as a their inventory management software.
As mentioned above, this will work for small businesses. But a distributor looking to grow their business will not be able to sustain their information this way – actually, it can become dangerous to use Excel for certain types of business activity. To be clear: Excel is an outstanding business tool. But like any tool, it works best when used for appropriate purposes.
Excel as an ERP
Let’s look at an example where a company uses Excel for their inventory management. At this company, their Excel spreadsheets are manually updated when shipments arrive, when they get around to it. And they're updated again when products are shipped out, some time after the fact. They use these spreadsheets for information about inventory: what's in stock, when to replenish and how much to order. They also use them for costing inventory, including landed costs like duty, brokerage and freight. So these are pretty important business factors, right?
After discussion this is what was uncovered:
- Its takes about an hour a day to fill in the spreadsheet.
- On-hand quantities and inventory spreadsheets often do not agree. A physical count must be done to get the accurate numbers.
By my calculation, this company spends 25 - 30 hours per month updating an "inventory management system" that is of little or no use and cannot be relied upon. It's clearly a waste of time and effort, but is this also a limiting factor in terms of the company's growth potential? It is, and many small companies limit their growth potential by using inappropriate business tools.
If your inventory is managed as part of the overall enterprise resource planning “ERP” software, and implemented properly, inventory is updated naturally as the underlying business transactions are processed. You're invoicing your customers and paying your suppliers for products anyway, so why not have the inventory updated automatically when you do so?
Read Now: Small Business Reporting Guide
Now, after implementing an ERP, Excel is not to be forgotten about. You can use Excel to drill down into the information your ERP is providing you. One of the most powerful and appropriate business uses of Excel - the Pivot Table report.
The Excel Pivot Table Report
In my experience, this is one of the least understood tools available to those who use Excel to analyze and report on data, and yet for many, it should be the tool of choice. Although Excel should not be used as a standalone inventory management (or data management) tool, when used in conjunction with proper inventory and accounting ERP software, it can provide powerful results. Using Excel Pivot Tables with ERP software eliminates all the downsides of using Excel as a business management reporting tool - there is no need to re-key data which eliminate the chance of human error, and the information is available in real-time.
Pivot Tables
Pivot Tables facilitate summarizing and thereby analyzing data. They are a style/type of report that allows users to easily manipulate data in a way that makes sense for their business. Let's use the example of an ERP system. With the right ERP solution, you can create a live link to your ERP data from within an Excel workbook and return the data as a Pivot Table report. What you'd get initially would look something like this:
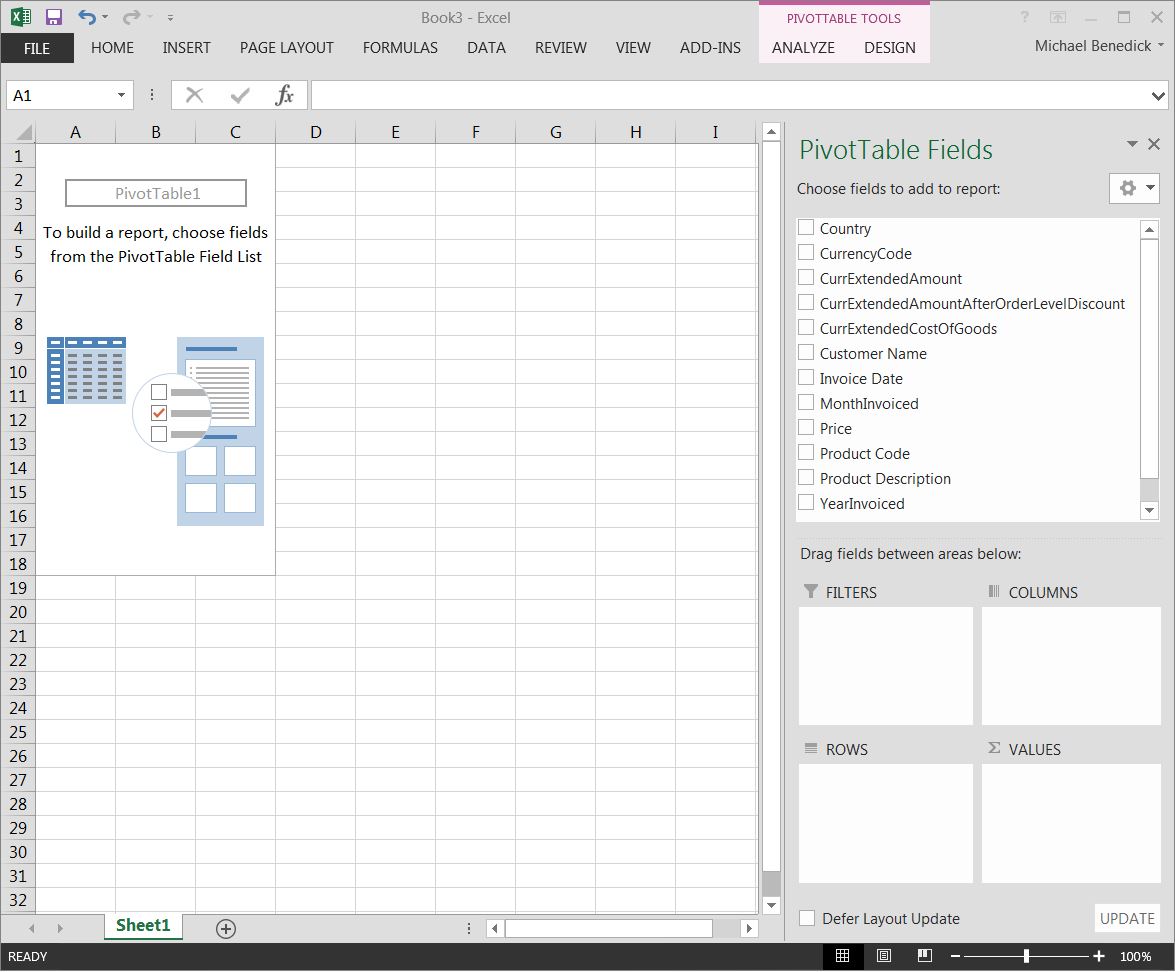
Click to Enlarge
After you've linked the data in Excel from the database of your choosing (in this example, your ERP database), essentially you are left with a list of the fields available from the database to which you've linked. This allows you to easily report on relevant information found within your ERP solution without having to re-key data.
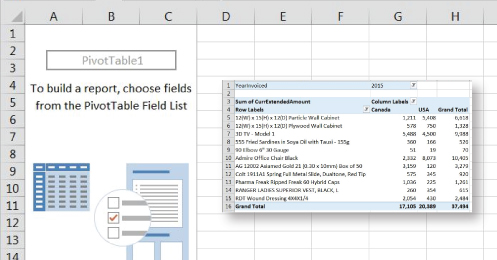
Working with the information in the right-hand panel, you can now use simple drag and drop actions to determine what information you would like to analyze in the rows and columns of the Pivot Table, and what data should be summarized. In this example, I'm analyzing sales data by product by country for the year 2015. It took me less than 30 seconds from start to get this:
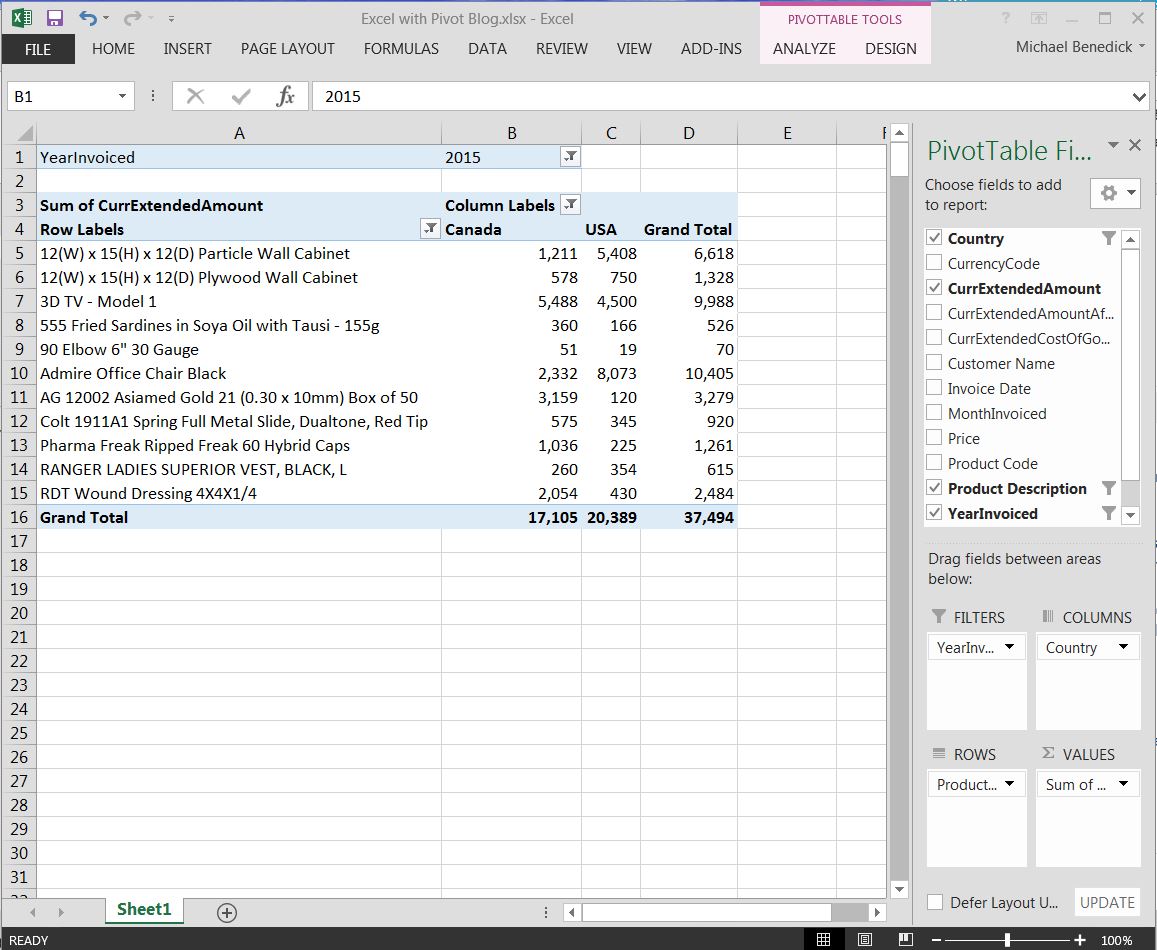
Click to Enlarge
Live Linked Data
Once again, simple drag and drop actions will allow me to change the content and even layout of this report instantaneously. One of the major benefits of linked reporting is that the data is always live
A simple right-click and refresh of the data set from within Excel will update the information according to what has been added/modified in your ERP solution. This simplifies the reporting process moving forward. Although using Excel Pivot Tables with ERP software is a familiar tool and great way to quickly report on data, one of the benefits of ERP software is access to other robust reporting tools. Work with your ERP partner to learn more about how to create reports using different tools - this will allow you to find the best tool for any given report.