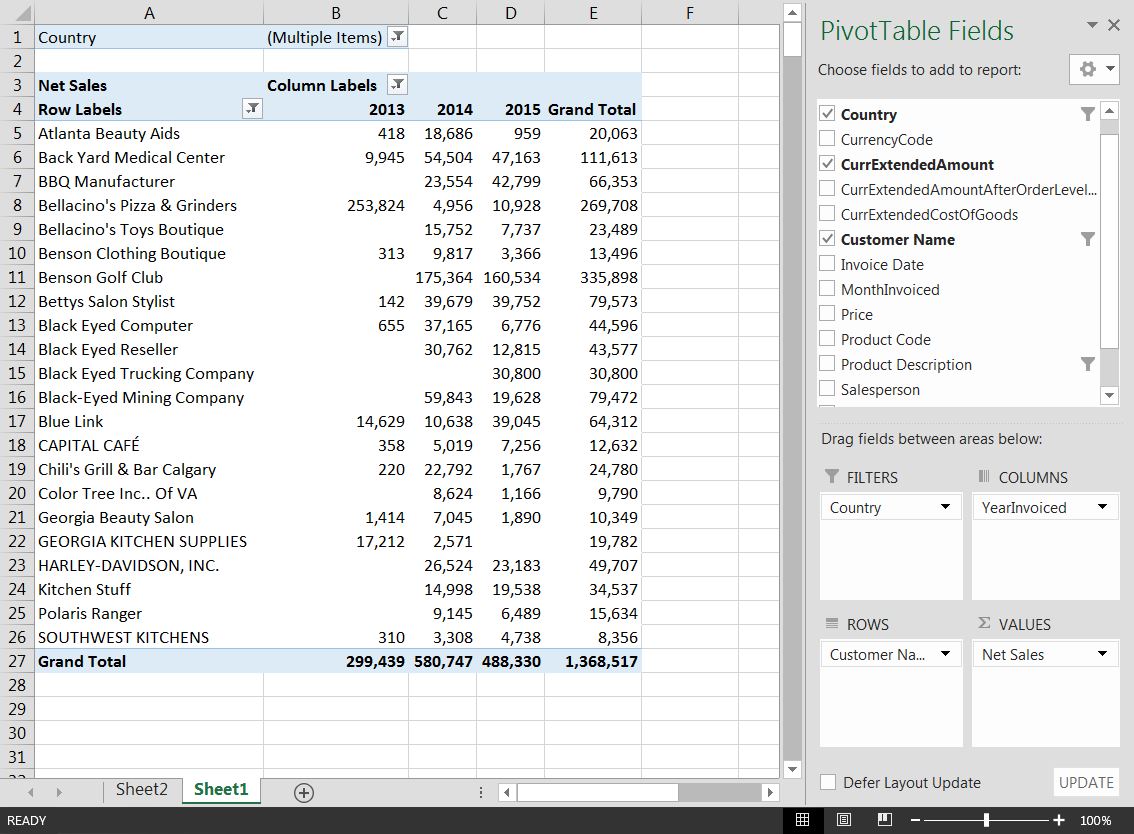
As discussed in a previous post, Excel Pivot Tables are powerful tools for analyzing and reporting on data from your accounting software package, and other business data sources. Starting back with Office 2010, Excel released a new feature that takes Pivot Tables a step further: the Slicer - which allows you to slice and dice an existing Pivot Table through new dimensions. For example, here's a simple Pivot Table summarizing sales by customer by year:
[caption id="attachment_238" align="aligncenter" width="450"]
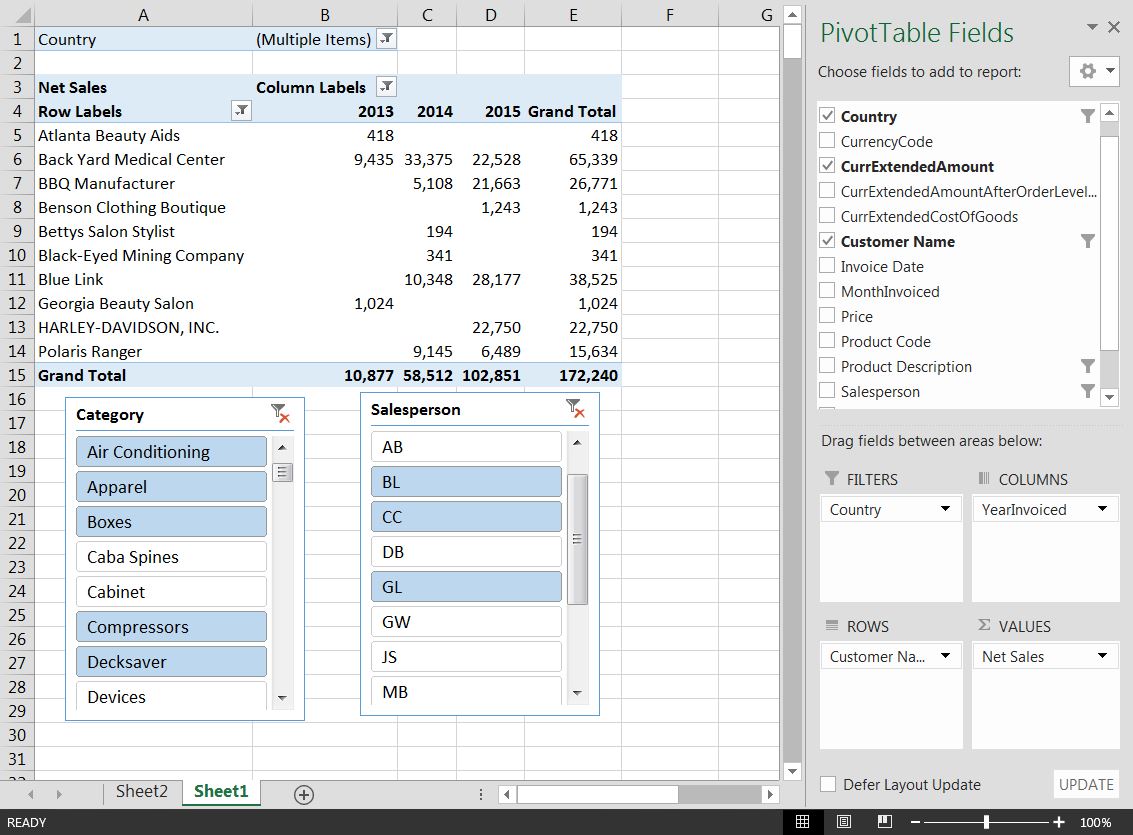
But what if we wanted to further analyze these sales numbers, slicing them by different salespeople and product categories, for example? Enter the Slicer:
[caption id="attachment_238" align="aligncenter" width="450"]
In this example we're still looking at sales by customer by year, but we've sliced it for sales by 3 salespeople only, and for just the Air Conditoning, Apparel, Boxes, Compressors and Decksaver product categories. Once again because this data is live linked from your ERP system or other databases, a simple refresh from within Excel will update the information to include anything that has been added/modified in your ERP system.


