Skip to content
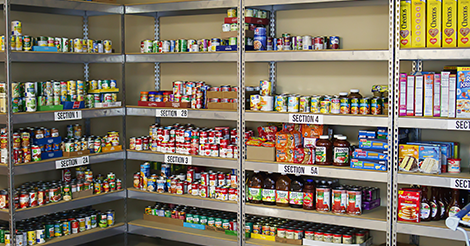
An executive dashboard is a powerful tool for the modern wholesale distribution business owner. A well-designed dashboard can quickly provide powerful insight into business health including summaries of complicated data translated into digestible views. Dashboards offer a visual display of organizational KPIs, metrics, and data that owners and employees can analyze in mere seconds. Information can be drilled down for a more granular, investigative view, which will help owners make smart decisions to improve their businesses' bottom line.
But the key to the success of dashboards for wholesale distributors, is having a fully-integrated wholesale distribution software in place to store all business data, including key metrics of the business in one central hub. This means users can easily pull data to create and automatically populate executive reports. It is also best to only display the most important information and to make the dashboard as clean and uncluttered as possible in order to reap benefits such as:
Increased Operational Visibility
With the right dashboards, you will know exactly what’s happening in all aspects of your wholesale distribution business instantly when you log in to the system on any given day, including information like views of sales outstanding in A/R, available credit, and A/R aging summary. For the best results, find a wholesale distribution software vendor that allows you to create multiple custom dashboards so you can switch back and forth between them. For example, you can have an additional dashboard that covers sales information such as sales by source, top selling products, top vendors, top customers, inventory quantities etc. You also want the flexibility to determine how this information is displayed, whether it be various types of charts (pie charts, column charts etc.), table formats, or simple text.
Data Drill Downs
The convenience of having all business data stored in one wholesale distribution software is that it is easy to "drill down" or further investigate information behind the metrics in the dashboard. By clicking on the metric, you can see more information such as factors influencing the summary of finances (A/R, A/P etc.), current account balances, month-to-date and year-to-date net profit or loss statements, key financial ratios such as liquidity, asset management and debt management...all crucial information to have at your fingertips as a wholesale distribution business owner.
Smart Strategic Planning
As you may have guessed, the primary objective behind dashboards is that they allow business owners to make smart decisions. It's not enough to create a business plan and hope things go according to your expectations - you need to verify and monitor that your business is performing according to that plan. Dashboards allow you to actually measure key indicators of business performance throughout every part of your organization and analyzing the data helps you decide which areas need improvement and which objectives need to be adjusted.
Employee Access
It's always good for management/employees to have an idea of what's happening in the business across all departments such as sales and accounting. Look for a software vendor that allows you to create user and group permissions so that each user login can have specific reports/dashboards available to them. This way, you are only showing employees the information they need in order to make better decisions about their day-to-day tasks.
Save time. Lots of it.
How many hours do you currently spend creating financial and operational reports? How often do you create them? With the right executive dashboard, you will always have real-time results from all the reports you need, saving countless hours a month. When information in your wholesale distribution software is updated, so will the information in the dashboards.
Here are a couple tips to keep in mind to improve reporting for your business...
First and foremost, choose the right wholesale distribution software vendor.
This is crucial for business owners looking to improve their reporting capabilities. Chances are that every wholesale distribution software vendor will demo dashboards during the sales process, however, it's important to not be distracted by the bells and whistles. Consider the reporting tools that are used behind the scenes to create the actual dashboards...are they easy to use? For example, Blue Link currently supports a variety of reporting tools depending on the nature of the report required. One of the reporting tools that we offer is SQL Server Reporting Services (SSRS), which is extremely useful for creating dashboards of information across departments. This reporting tool allows Blue Link customers to generate any report/chart in any format using information stored within the Blue Link system. The idea is to simplify the process of populating dashboards and to avoid having to manually enter data which is prone to human error, incomplete/wrong data or outdated information.
The dashboards are only as good as the integrity of the data behind them. The benefit of having an all-in-one wholesale distribution software such as Blue Link is that data from all areas of the business is collected and stored within the system and can be pulled to create various reports. Since the system handles everything from inventory management, accounting, warehouse operations, sales orders, purchase orders, invoices, lot tracking, landed costs, commission processing and more, you are able to report on any aspect of your business You don't have to input data from multiple sources and disconnected systems.
Be selective when choosing metrics.
It's not necessary to view everything under the sun when it comes to your business, as this can become overwhelming quite quickly. The first step is to decide which metrics are the most important to your wholesale distribution business. For example, an obvious one would be net income. After choosing this key metric, the next step is to figure out the “underlying” factors such as sales and revenues which influence the net income.
Remember, you don't have to display everything in one dashboard. You can create supporting dashboards such as a sales specific reports that display sales activity influencing the net income. Think about what factors influence sales numbers in your business. Should you keep track of the number of proposals sent out? Which products sell better than others, or what the costs of products are? This is the recipe for creating clear dashboards and understanding which areas need improvement and which steps to take to meet those specific objectives.
Take a look at the below video which demonstrates how Blue Link's sales reports and dashboard views work, including displaying information in various formats, how to drill down into data, customizing the dashboard and more.